Performance Testing
First of all, if you don’t know Performance Testing much, below materials are good to kick off
- Web Application Performance Requirements Deriving Methodology: https://pdfs.semanticscholar.org/620e/7bb37c4aa78f8f6fcd5602f74b99c731553f.pdf
- Performance Testing Guidance for Web Applications: https://docs.microsoft.com/en-us/previous-versions/msp-n-p/bb924375(v=pandp.10)?redirectedfrom=MSDN
So now your boss is asking you to do Performance Testing.
- JMeter. You need to have a performance testing tool which is open source and free, can support test script recording, and can generate insightful HTML reports. Apache JMeter may be used to test performance both on static and dynamic resources, Web dynamic applications. It can be used to simulate a heavy load on a server, group of servers, network or object to test its strength or to analyze overall performance under different load types.
- InfluxDB. JMeter can provide very friendly and detailed HTML report after testing run. However, you still want to persistent your JMeter testing result in DB so that you can compare your test results with previous’. InfluxDB is the one can help you out. InfluxDB is an open-source time series database developed by InfluxData. It is written in Go and optimized for fast, high-availability storage and retrieval of time series data in fields such as operations monitoring, application metrics, Internet of Things sensor data, and real-time analytics
- Grafana. InfluxDB can help you store the time series JMeter data but you still want to have a on-the-fly dashboard to help you monitor and visualize the real time run of JMeter and its histories. Grafana is the open source analytics & monitoring solution for every database. It allows you to query, visualize, alert on and understand your metrics no matter where they are stored. Create, explore, and share dashboards with your team and foster a data driven culture so you can analysis the performance testing reports better
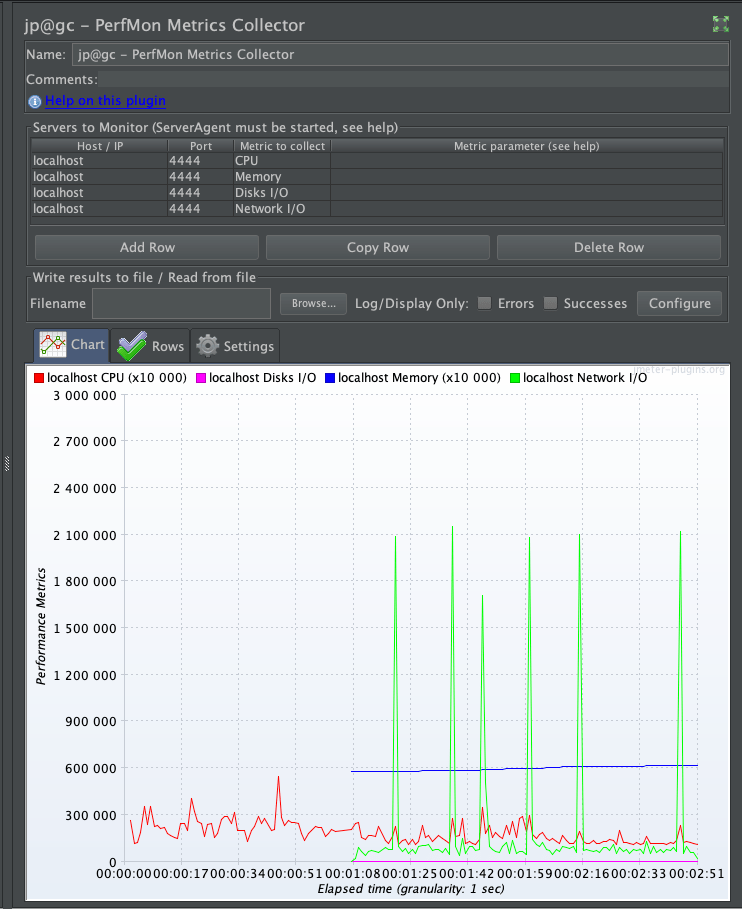
- Perfmon. During a load test, it is important to know the health of the servers loaded. It is also nice to see if you are targeting a cluster if the load is correctly dispatched. To address this, the plugin package now supports server monitoring! Using it, you can monitor CPU, Memory, Swap, Disks I/O and Networks I/O on almost all platforms!
JMeter
Reference
- OPTIMIZE JMETER FOR LARGE SCALE TESTS: https://octoperf.com/blog/2017/10/12/optimize-jmeter-for-large-scale-tests/
- JMETER RESULT ANALYSIS: THE ULTIMATE GUIDE: https://octoperf.com/blog/2017/10/19/how-to-analyze-jmeter-results/
- Help! My boss wants me to load test our application!: http://jmeter.apache.org/usermanual/boss.html
Supposed you have read through JMeter user manual http://jmeter.apache.org/ and know how to use it. If not yet, https://www.youtube.com/watch?v=xAnSZMGO-xE&list=PLIMhDiITmNrLcYc00erJ9T36rxShFHuIS is a very good tutorial
Script Recorder & Distribution Mode
- Use the test script recorder to capture user’s operation:
- Apache JMeter HTTP(S) Test Script Recorder: http://jmeter.apache.org/usermanual/jmeter_proxy_step_by_step.html
- JMeter is written by Java and all of the concurrents are Threads so all of the constraints against JVM will be there for JMeter. A single JMeter client running on a 2-3Ghz CPU (recent cpu) can handle 300-600 threads depending on the type of test. My laptop is MacBook Pro and its processor is 2.8GHz and in my tries, it supports 500 threads gracefully and will run into problem if I try to run with 1000 threads.
- Distribution Testing: http://jmeter.apache.org/usermanual/jmeter_distributed_testing_step_by_step.pdf
- There is an opinion that we should also avoid distribution mode. Can just use Jenkins to trigger JMeter in standalone mode and merge the result after the testing is done. The reason is JMeter distribution mode is through RMI however RMI is not that efficient.
JMeter Report
Run JMeter from command line: avoid using JMeter UI during load tests, it can eat a lot of memory
- jmeter -n -t JMX_FILE -l JTL_FILE -r
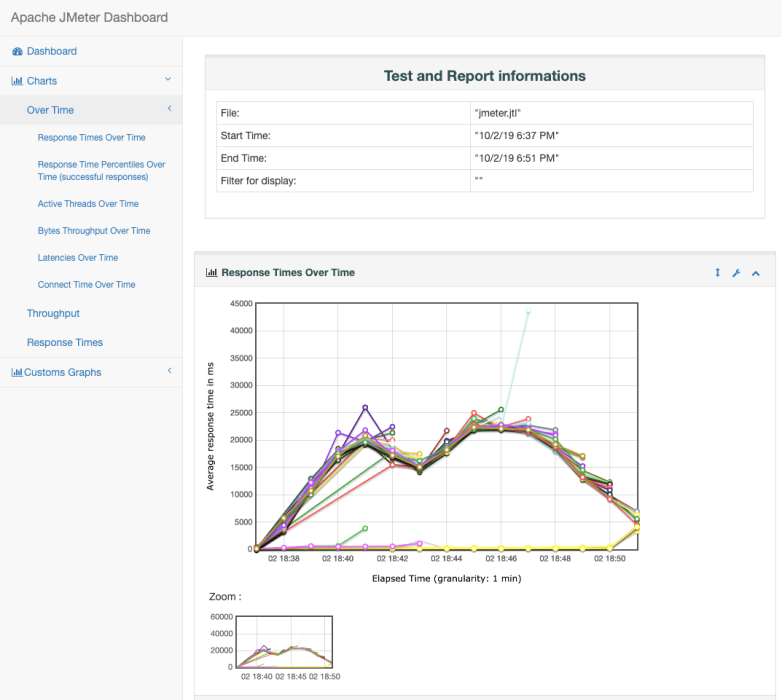
Since JMeter 3.0, it provides a very powerful feature to genarate HTML Report DashBoard
- jmeter -g JTL_FILE -o OUTPUT_FOLDER
- -g JTL_FILE: relative or full path to the JTL file. Example: jmeter.jtl,
- -o OUTPUT_FOLDER: the folder in which the HTML report should be written
Metrics:
When analysis the report, should focus on,
- APDEX (Application Performance Index) – https://en.wikipedia.org/wiki/Apdex
- Example: if there are 100 samples with a target time of 3 seconds, where 60 are below 3 seconds, 30 are between 3 and 12 seconds, and the remaining 10 are above 12 seconds, the Apdex score is:
-
- Example: if there are 100 samples with a target time of 3 seconds, where 60 are below 3 seconds, 30 are between 3 and 12 seconds, and the remaining 10 are above 12 seconds, the Apdex score is:
- In JMeter, you can use apdex_satisfied_threshold (default: 500ms) and apdex_tolerated_threshold (default: 1500ms) to set the threshold
- Throughput: Calculated as requests/unit of time. The time is calculated from the start of the first sample to the end of the last sample. The formula is: Throughput = (number of requests) / (total time).
- Elapsed Time / Connect Time / Latency: should be as low as possible, ideally less than 1 second.
- Median: should be close to average elapsed response time,
- XX% line: should be as low as possible too. When it’s way lower than average elapsed time, it indicates that the last XX% requests have dramatically higher response times than lower ones,
- Standard Deviation: should be low. A high deviation indicates discrepancies in responses times, which translates to response time spikes.


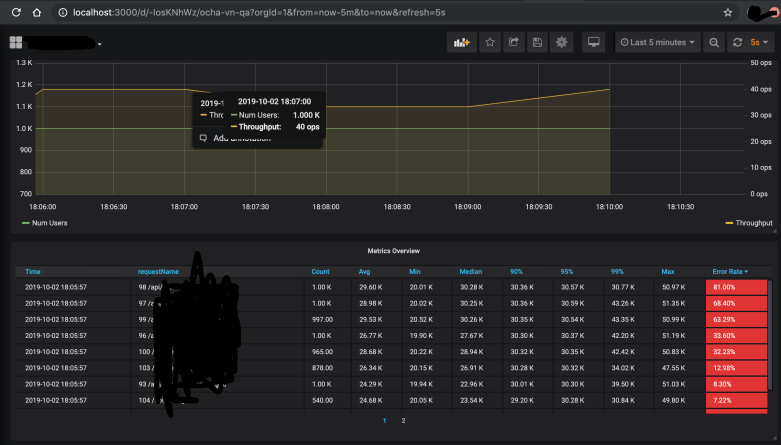
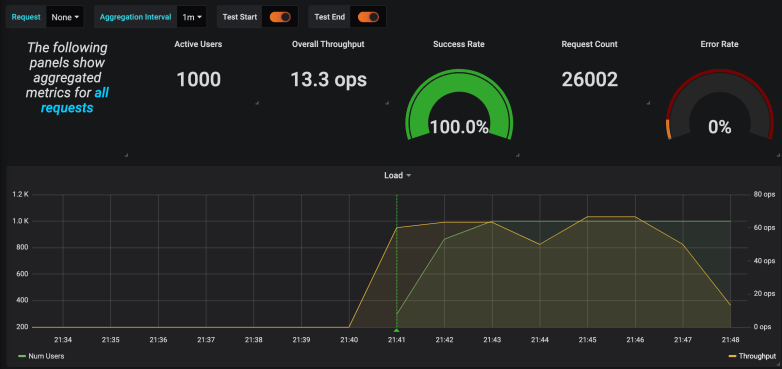
InfluxDB + Grafana
Detailed Instruction: https://performanceengineeringsite.wordpress.com/2018/02/08/novatec-apm-dashboard-preconfigured-metrics/ . Overal steps:
- Install and start InfluxDB ‘influxd -config /usr/local/etc/influxdb.conf’, create database
- Install Grafana ‘grafana-server –config=/usr/local/etc/grafana/grafana.ini –homepath /usr/local/share/grafana –packaging=brew cfg:default.paths.logs=/usr/local/var/log/grafana cfg:default.paths.data=/usr/local/var/lib/grafana cfg:default.paths.plugins=/usr/local/var/lib/grafana/plugins’ and configure Influx DB for it
- Download JMeter InfluxDB Writer https://github.com/NovaTecConsulting/JMeter-InfluxDB-Writer/releases and configure a Backend Listener for InfluxDB. Backend Listener is Asynchronous listener that enables you to write time series data to InfluxDB which can be used by NovaTec APM Dashboard in Grafana
- Remember to choose ‘rocks.nt.apm.jmeter.JMeterInfluxDBBackendListenerClient’
- https://www.blazemeter.com/blog/how-to-use-grafana-to-monitor-jmeter-non-gui-results-part-2/
- Start JMeter run, and then you can use below command to see if the JMeter is barfing records to InfluxDB
- Use ‘curl ‘http://localhost:8086/query?pretty=true’ –data-urlencode “db=jmeter” –data-urlencode “q=SHOW SERIES”‘ to query InfluxDB, you should see records
- Go to Grafana, if you can see the below on-the-fly dialog then it works
Perfmon
- Follow https://jmeter-plugins.org/wiki/PerfMon/ to install PerfMon plugin for JMeter and start the PerfMon Agent from the server, then configure JMeter to monitor