Introduction
Performance Testing is Non-Functional testing performed to evaluate application performance under some load and stress conditions.
It is generally measured in terms of speed, scalability & stability for the user activity.
This is to verify the behaviour of an application under load and to avoid business loss. Many complex systems have to undergo a performance test before they are launched online. Through performance testing, including capacity planning, system bottleneck detection, reliability checks and high-load stress testing

Performance Metrics
Usually, a performance test will have an overall background, such as the project encounters some kind of performance bottleneck, or the project needs to understand the bottleneck of some modules. Record the test background to help determine the direction of performance testing. Clearly record the purpose of the performance test and explain what problems the test aims to solve. After that, all test items are designed around the problem and the process.
Common key indicators (level 1)
- Response time
- concurrent users
- QPS/TPS
- Error rate
Common key indicators (level 2)
- Resource usage (cpu, memory, disk throughput, network throughput)
- Process metrics (GC time, number of coroutines/threads, number of middleware connections)
- DB indicators (SQL time consumption, cache hit rate, lock wait times)
Common Performance Terms
| Term | Definition |
|---|---|
| Concurrency | Refers to the ability of a processor to handle multiple tasks at the same time (logically) |
| Parallel | Multiple processors or multi-core processors process multiple different tasks at the same time (physically simultaneously) |
| QPS (Query Per Second) | The number of requests the server processes per second (req/sec over a period of request time) |
| Transactions | A collection of one or several requests from the user |
| TPS (Transaction Per Second) | The number of transactions processed by the server per second (a transaction may include multiple requests) |
| Request Success Number | In a stress test execution, the number of successful requests (RSN) |
| Request Failures Number | In a stress test execution, the number of failed requests (RFN) |
| Error Rate | RFN/(RSN+RFN)*100% |
| Max Response Time | The maximum time of a transaction from the time sending a request to the time response made by the system |
| Minimum Response Time | The Minimum time of a transaction from the time sending a request to the time response made by the system |
| Average Response Time | The average time of a transaction from the time sending a request to the time response made by the system |
Case Study – apriorit.com
Load vs Stress Testing
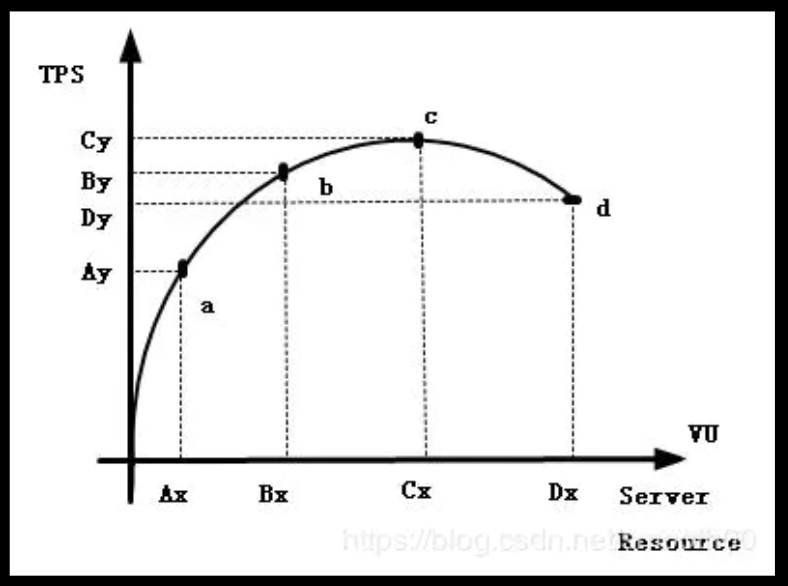
Load testing
A load test is to be conducted to understand the behaviour of an application with an expected load and find out the maximum (a to c)
- The goal of a load test is to determine and ensure that the system continues to function well when it is put under stress from over the maximum workload expected. In addition, the load test also evaluates the performance characteristics. For example, the response time, transaction processing speed and other time-related indicators. In some high-concurrency scenarios, load testing is the most common way to test the capacity of a system in extreme situations by constantly increasing the stress on the system until some system resources are exhausted, such as CPU or network bandwidth.
Stress testing
A stress test is to find out the behaviour of an application when the load goes above the expected maximum (b to d)
- A stress test, also called a strength test, refers to testing the ability of a system in response to a testing scenario within a preset load range, such as full-load CPU or saturated memory. Unlike load testing, stress testing does not tend to exceed the expected upper limit, but focuses more within the capacity plan to ensure system availability. So usually the load testing will be carried out first, and then, according to the load testing results, the stress testing scheme is specified.
JMeter Performance Testing
Apache JMeter is a java based open source performance testing tool for analysing and measuring performance of various services with a focus on web applications.
Installation
- Java is required
- Download the JMeter zip file from the website and unzip it (download here: apache-jmeter-5.x.x.zip)
Launch JMeter GUI mode
- In the terminal, cd to the bin folder which is in the unzipped JMeter folder
- Run command:
sh jmeter.sh - Usually is used to create test plan and debugging
- Else, it can slow down CPU utilisation and affect JMeter performance
Test Plan Components
JMeter overview

Thread groups
- Thread Groups is a collection of Threads
- Each thread represents one user using the application under test, simulates one real user request to the server
- The controls for a thread group allow you to set the number of threads, iterations and ramp-up period for the test
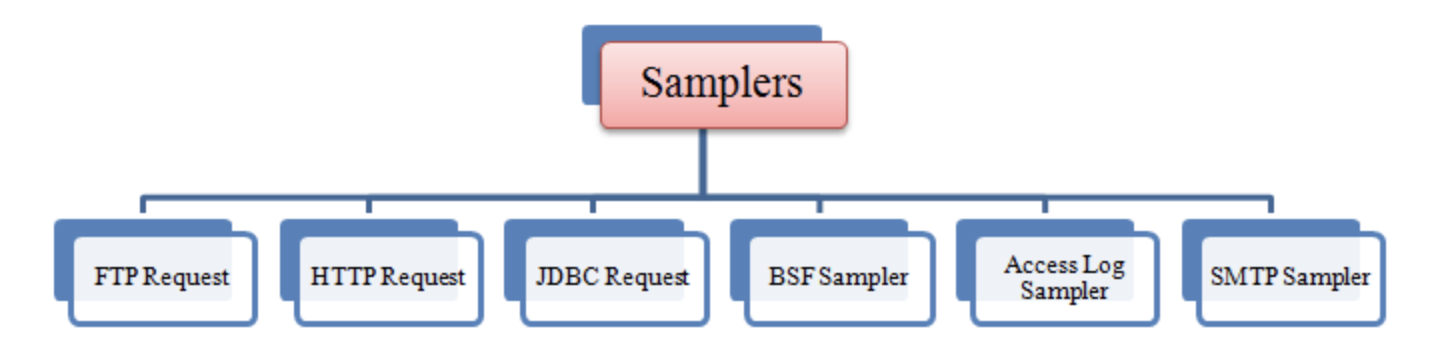
Sampler
- JMeter supports performance test for many different applications/servers/protocols
- A sampler is request type that we want to send
- E.g. The This HTTP request sampler lets you send an HTTP/HTTPS request to a web server
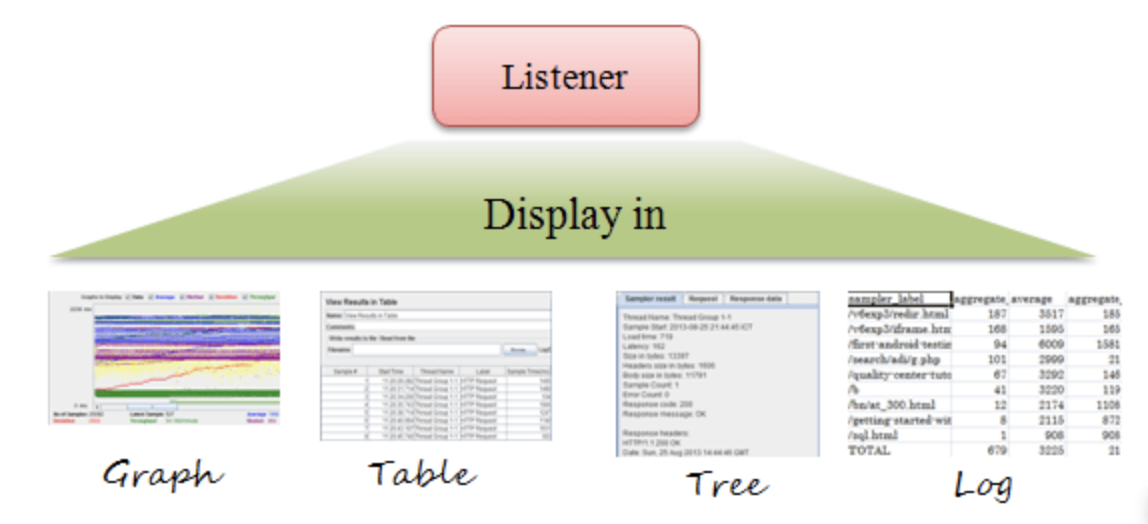
Listener
- Listeners are the component that displays the test results
- It can be in the form of a tree, table, graph or log
- The variety of listeners allow us to monitor the requests sent and also analyse the results from the system under test
Assertion
Assertion is used to validate response of the request
- Response assertion (response code)
- Duration assertion (miliseconds)
- Size assertion (bytes)
Configuration Element
- HTTP Header Manager (add in token and header etc)
- CSV Data Set Config (prepare your data for the parameters)
Timer
- JMeter sends requests without any delay in between, which can overload and not achieving the result we want
- Add timer in between requests to simulate real world user traffic experience
- Constant Timer: delays each request for the same amount of time
- Random Uniform Timer: delays each request for a random amount of time (Total delay = random delay maximum + constant delay offset)
Logic Controller
- Logic controller decides “when & how” a request is being executed
- Loop Controller
- Random Order Controller
HTML Report Generation
- Reduce resource requirement by disabling or deleting listeners while running the test on non GUI mode (good practice)
1. Non GUI mode
- Create a test plan (.jmx)
- In the terminal, cd to the bin folder
- Run command
sh jmeter -n -t file_path/test_plan.jmx -l file_path/result_log.jtl (or.csv) -e -o file_path
2. GUI mode
- Tool → generate html report → 3 items needed
- File directory for the
result_log.jmx (or .csv),output directoryanduser.propertiesfile which is in the JMeter bin folder - Click “report generation”
3. Granularity setting for the report
- The default granularity time is 60000 ms (1 minute)
- If the test only takes a short period of time, using a 60000 ms granularity will not give any result for various graphs in the report
- Change it by opening up the reportgenerator.properties file in the JMeter bin folder with a text editor
- Search for
overall_granularity = 60000and reduce the time - It must be higher than 1000 ms otherwise throughput graphs will be incorrect (user manual for report generation)
Report Analysis
Record
- System environment. Since the environment of the system under test directly affects the test results, the following information needs to be recorded
- system version
- System Architecture Diagram
- System hardware resources (cpu, memory, network bandwidth)
- Stress Test Tool Architecture Diagram
- Hardware resources of stress testing tools (cpu, memory, network bandwidth)
- Test result. Record detailed test process data and form the test report. Common record indicators
- Scenario variables — the number of deployment instances, the amount of DB data, etc.
- Stress measurement tool data — qps, delay quantile, error rate, etc.
- System data under test — cpu usage, network traffic, disk usage, etc.
| SUT (System Under Test) instance# | QPS | tp50 | tp90 | tp99 | Error Rate | CPU Usage Rate |
Browse
https://www.youtube.com/embed/M92oYbiVhFw?wmode=opaque
Analysis
Troubleshoot
